I've been after a copy of Graphis Diagrams ed. Walter Herdeg (Graphis, 1974) for years. Always hoped I'd find it in a second hand book store, alas in the end I snagged it on Amazon Marketplace. It's had the edges 'repaired' or at least protected with tape, but overall it's in pretty good condition for a book almost as old as me.
Their are a lot of things to love about this book. First up, the format - it's square. Then of course there is the multi language text; French, English and German. Which somehow reflects the internationalism of the times. Then of course there's the subject matter - information graphics and diagrams, or what would become today's hot ticket of 'dataviz'. The cover itself looks really contemporary, with a nod towards a parallel coordinates chart.
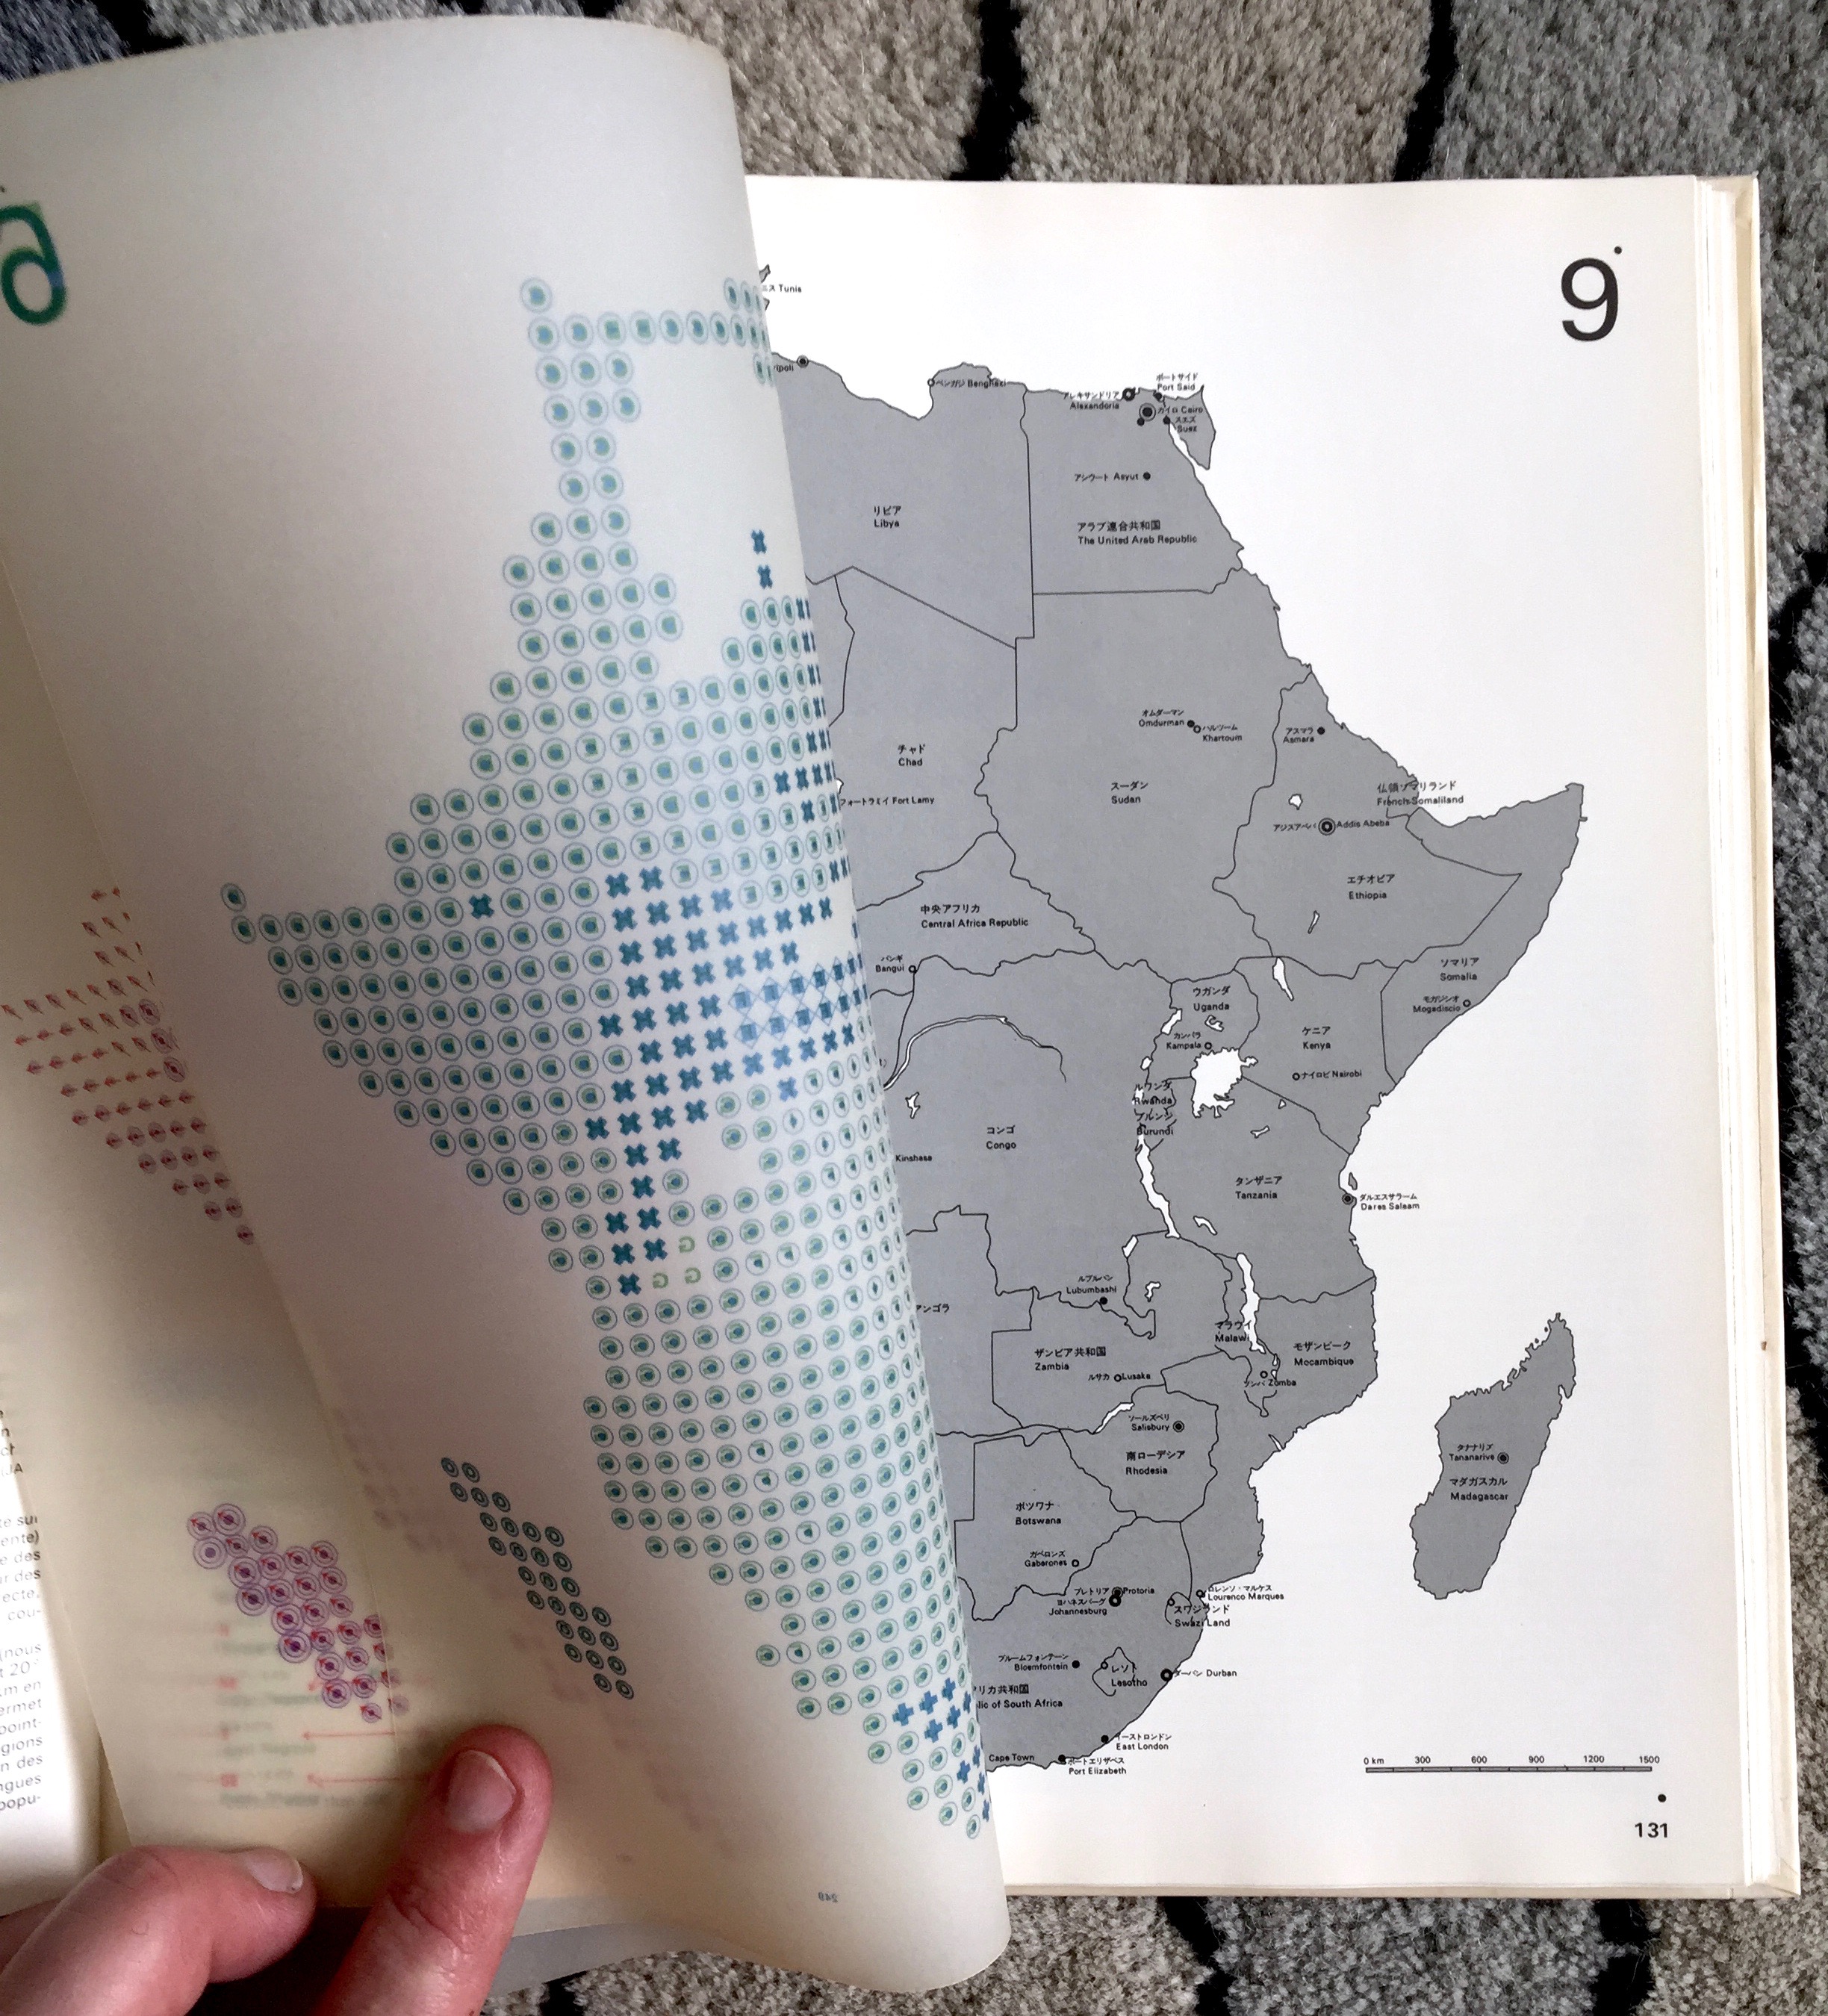
Inside it's full of gems from around the world (as you'd expect in a Graphis annual). From a dataviz point of view it's a mixed bag. Some of the pieces are wonderful, like the use of transparent overlays to show this dataviz on Africa (below). But there's also plenty of what todays visualisation gurus (aka Tufte or Few) would consider criminal.
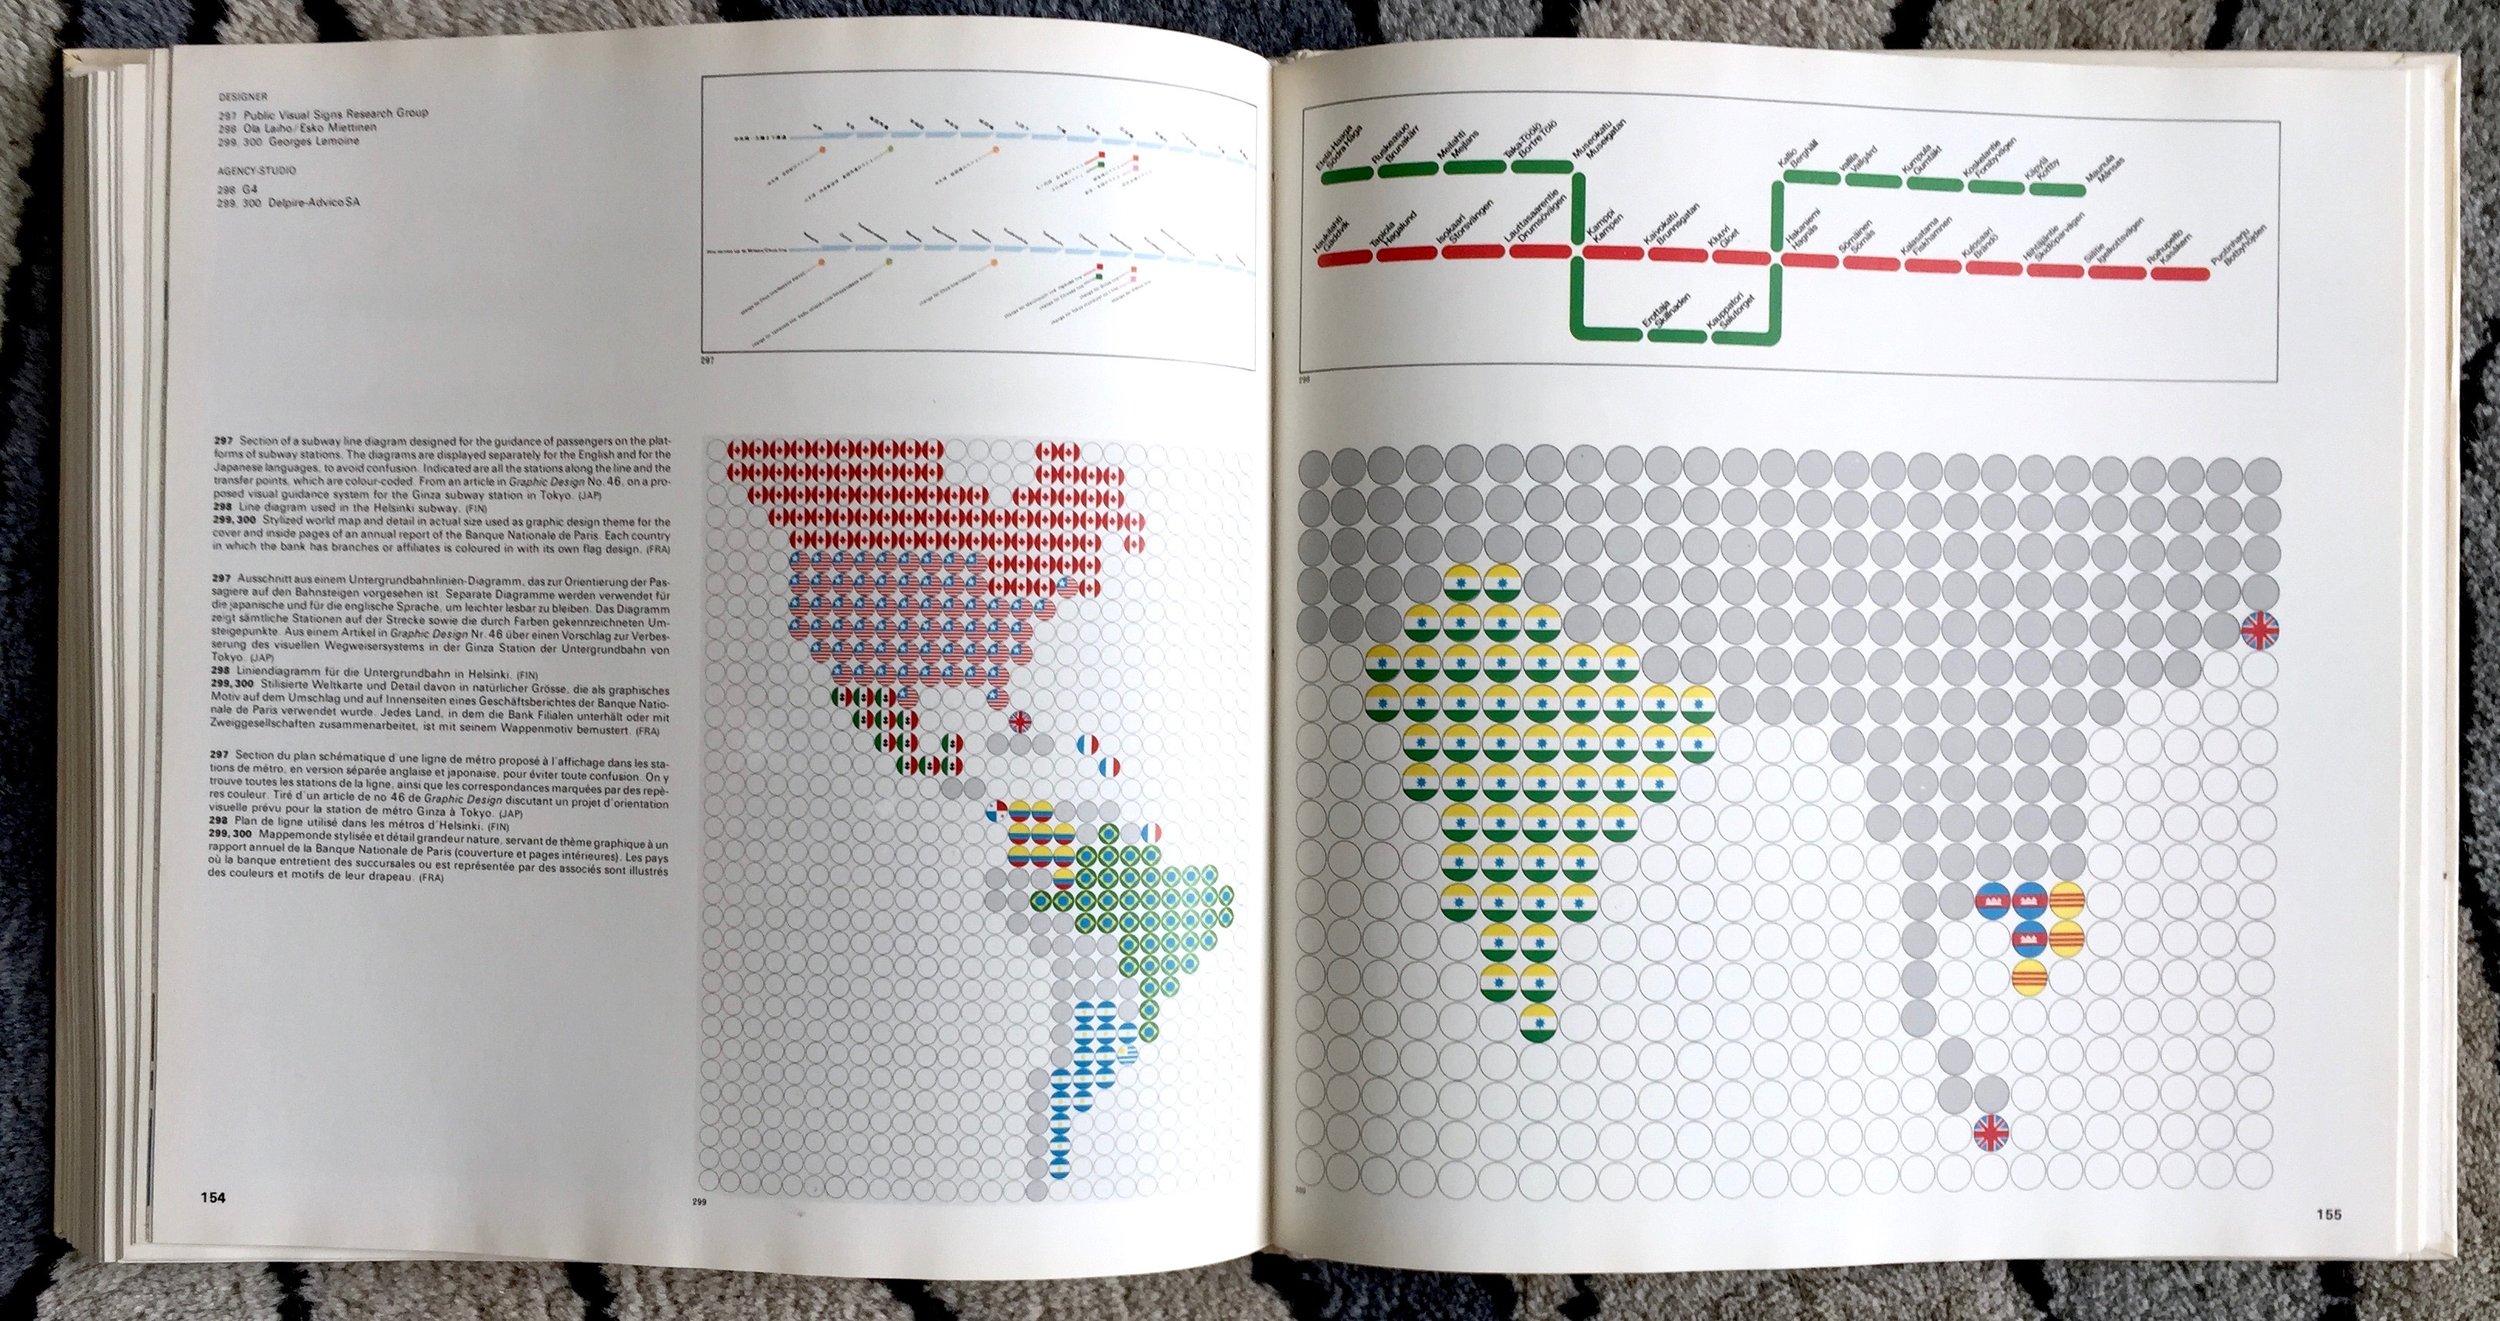
Here's a sampling of a few more spreads.
I pulled out these few pieces to show some of the other highlights, as well as the crimes and misdemeanours.
Couldn't resist including the pulsar dataviz that Peter Saville used on the Unknown Pleasures album by Joy Division. Have a sneaking suspicion he may well have had a copy of this book on his studio bookshelf, no matter what he says about being given the image by the band.
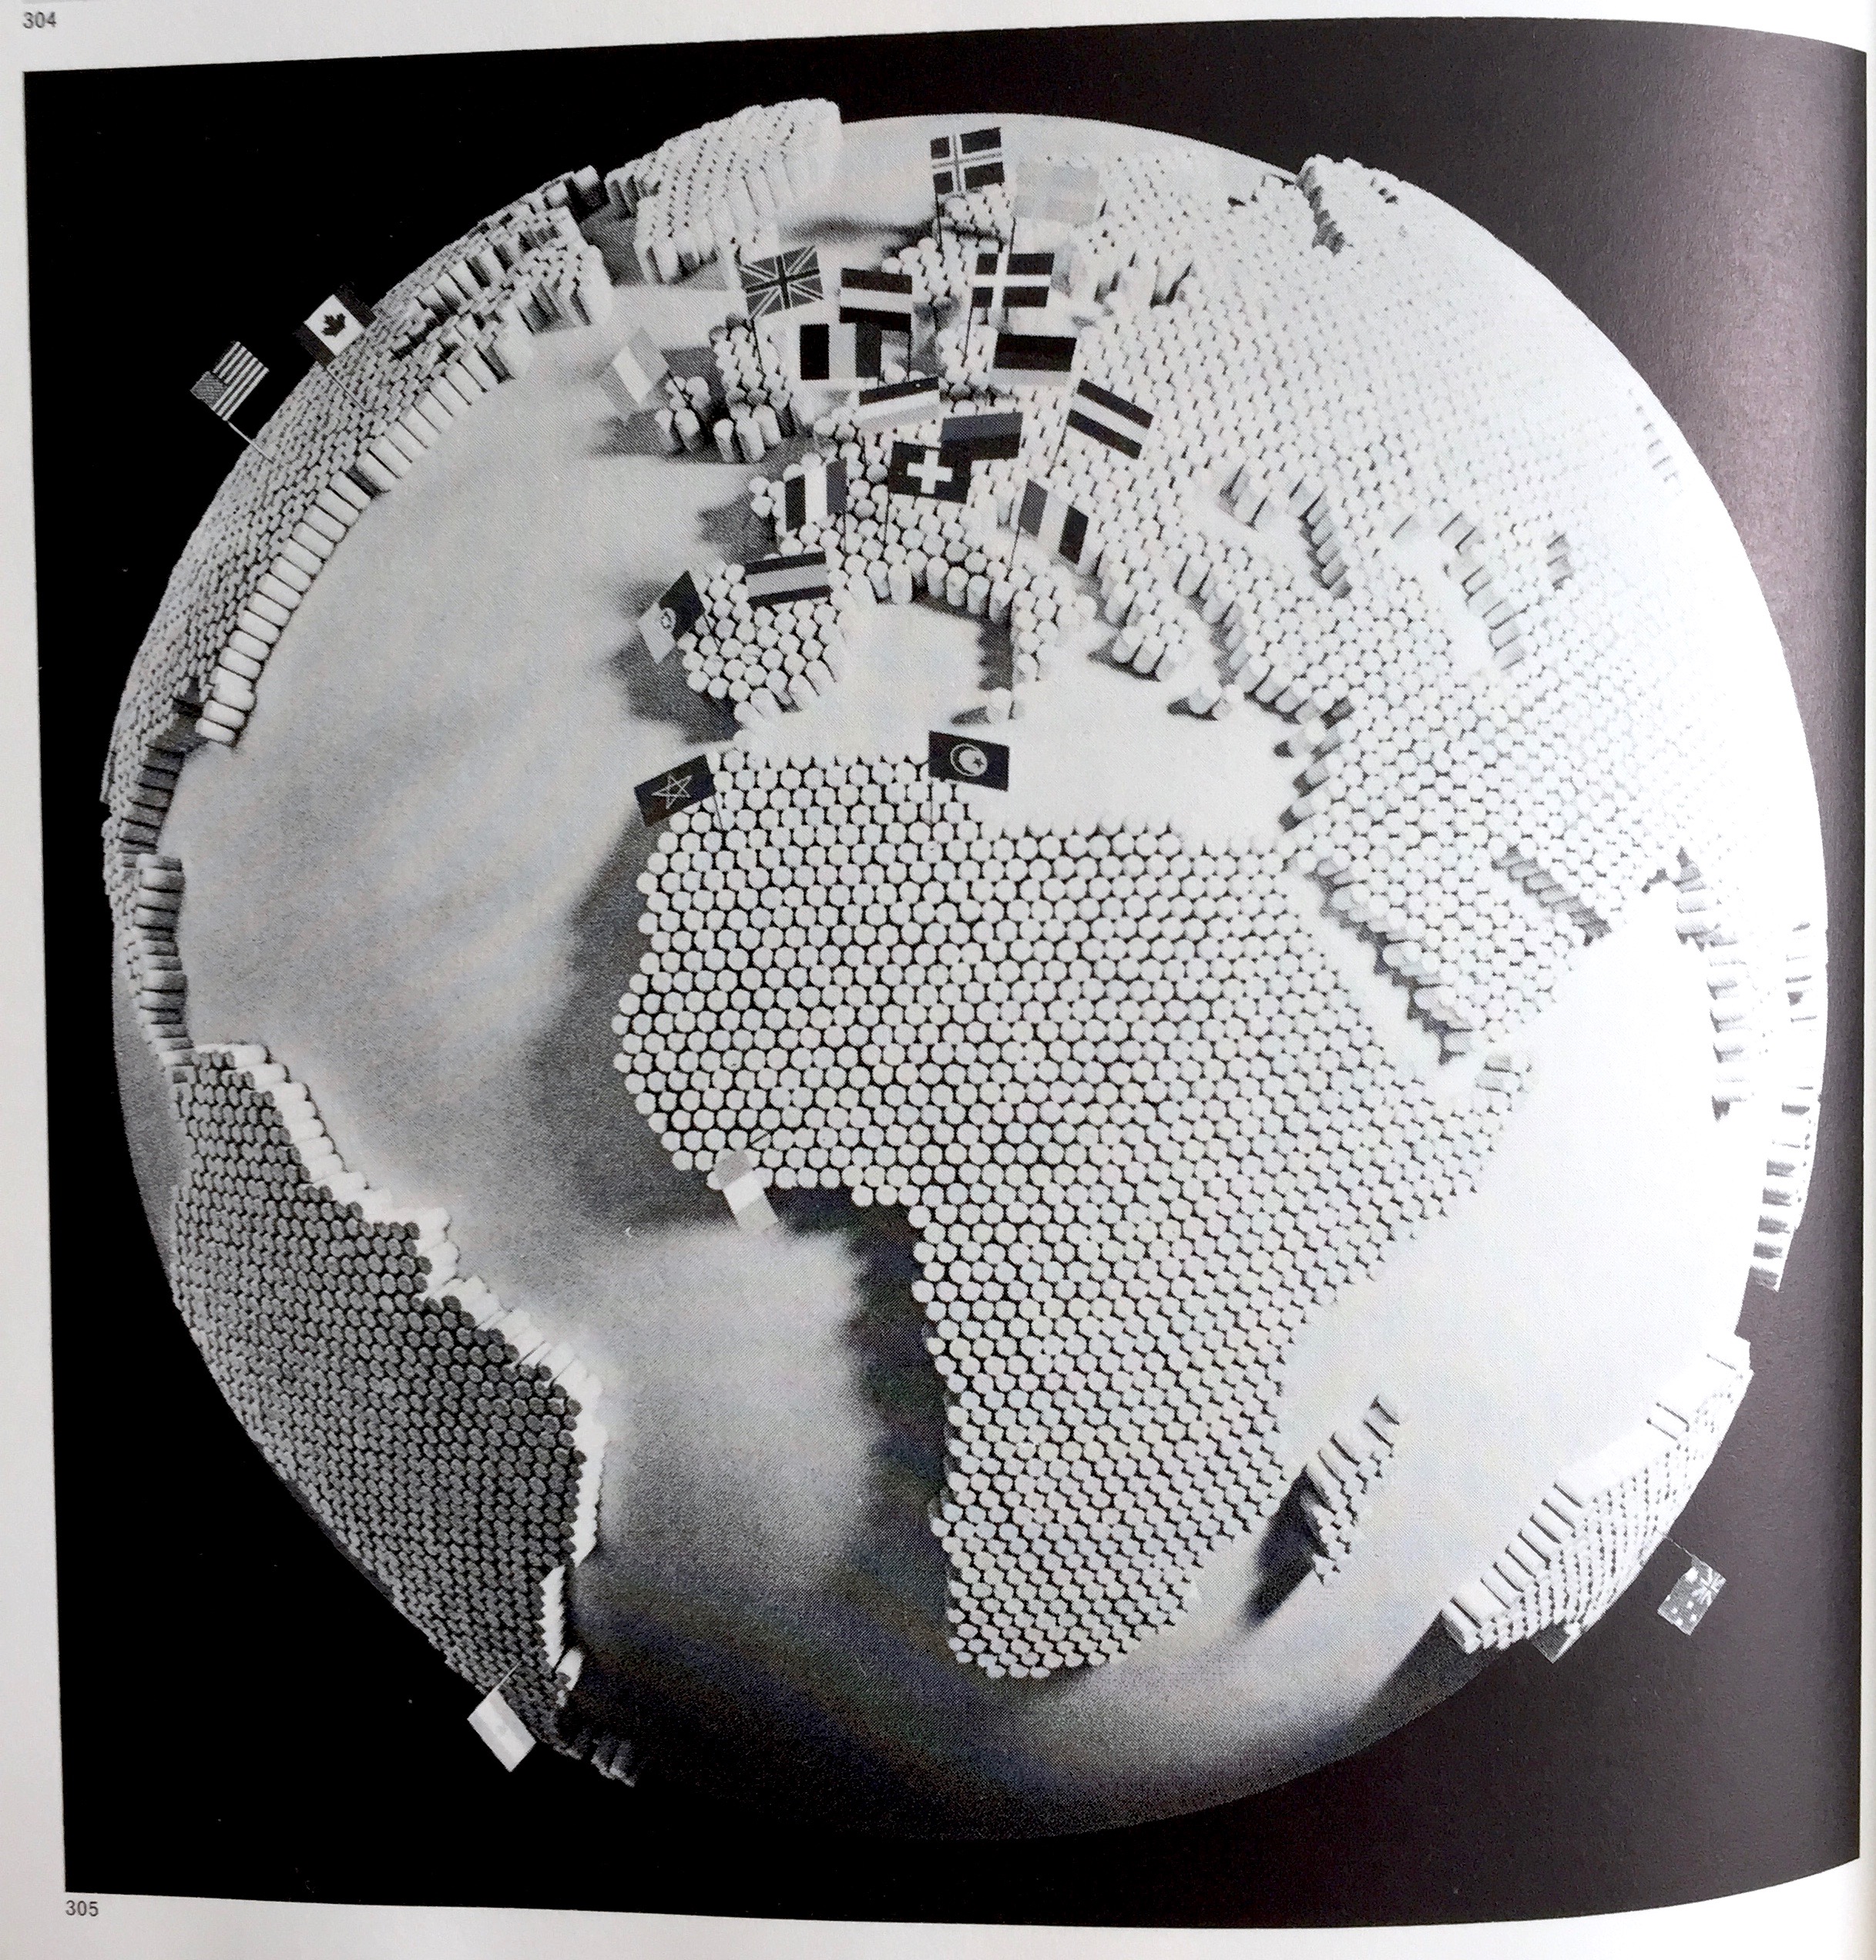
And finally this one, your guess is as good as mine regarding the meaning...


